
Carrot
September 3, 2026
📊 Samsung SDI: Checking the Numbers Between ESS Expectations and Policy Gaps - 2026.09.03
Hi, it’s Danggeun, someone who truly cares about chart numbers. Samsung SDI recorded a daily change of +0.19% at the September 3 closing price of ₩539,000,, while its gain over the past month was presented as 38.38% [2]. Wow, expectations seem to have been reflected in the chart pretty quickly. The key question now is not so much whether the ESS story can grow further, but whether those expectations can lead to actual business results and policy support.
📊 The chart ran up quickly, and volatility grew with it
The reference data shows that the August 27 closing price was ₩569,000, recording a daily change of +10.27%. On September 1, it fell to ₩569,000,, and on September 2, to ₩538,000. The September 3 low was ₩525,000,, while the closing price was ₩539,000. With the gap between the recent high and low widening considerably, the current chart looks less like a smoothly one-directional market and more like a period that keeps testing the volatility threshold.
The recent low around ₩525,000 is worth considering as a short-term support candidate, while the September 1 high of ₩600,000 and the September 2 high of ₩569,000 are useful reference points when watching overhead resistance. That said, this is not a price forecast but a chart interpretation drawn from the recent trading range. To really identify the range-bound pattern, we need to check where the closing price repeatedly holds. Danggeun sees Samsung SDI now as being in a phase where support and resistance are being checked again after ESS expectations were priced into the chart in advance.
🎯 The U.S. ESS bidding results are clear in the numbers
The most eye-catching business development is the U.S. ESS bidding result. Samsung SDI secured 76% of the first-round bid volume, while SK On took more than half of the second-round bid. Combined across both rounds, Samsung SDI’s share was 56%, reportedly the highest among Korea’s three battery makers [1].
These figures matter because Samsung SDI did not merely get mentioned in the U.S. ESS market; it secured a substantial share based on actual bid volume. However, reports also note that a rival’s share grew in the second round. So the interpretation should not move in only one direction. The cumulative share is a strength, but the competitive landscape can differ by round. In chart terms, it feels necessary to look not only at the top of the range but also at the zones where trading was concentrated.
💡 Policy support shows both expectations and gaps
A September 2 report said that industry observers were disappointed because the government’s battery support measures excluded tax credits for the three battery makers’ export volumes and a direct-refund system. At the same time, next year’s budget proposal reportedly includes a project to advance an integrated battery management system [3]. This is less a case of support measures disappearing entirely than of a difference between the approach the industry expected and the approach actually reflected.
This variable should be viewed separately from Samsung SDI’s individual business performance. The share secured in the U.S. ESS bidding is an issue of company performance and market competition, while tax credits and direct refunds concern policy design. Bundling the two together makes the numbers harder to interpret. Seriously, the more positive news overlaps, the more important—and interesting—it becomes to separate each item by source and nature.
🔍 Between securities-firm forecasts and actual results
Hana Securities forecast that battery demand would increase as domestic ESS installations expand, creating greater business opportunities for Korea’s three battery makers, including Samsung SDI [4]. Let me first clarify that this is a securities-firm forecast, not a plan confirmed by the company or an earnings announcement. Another report also suggested that ESS market expansion driven by rising solar installations could contribute to an improvement in Samsung SDI’s performance [5].
Ultimately, the current story brings together the market share confirmed in the U.S. bidding, the outlook for growing domestic ESS demand, and the gap in the form of policy support. However, the provided material does not confirm when or to what extent bid volume will translate into revenue and profit. With the numbers having run up so quickly, the next variables are whether earnings figures follow, whether policy changes are added, and whether support around ₩525,000 holds. No all-in buying, no all-in selling—act only when support breaks. Danggeun believes the unresolved point is not how long the ESS expectations will last, but what earnings figures will ultimately confirm them.
📰 Reference News (5)
SK On Expands ESS Battery Supply… Diversifying Its Business in the U.S. Market
네이버뉴스 · 2026.09.03
📰 View original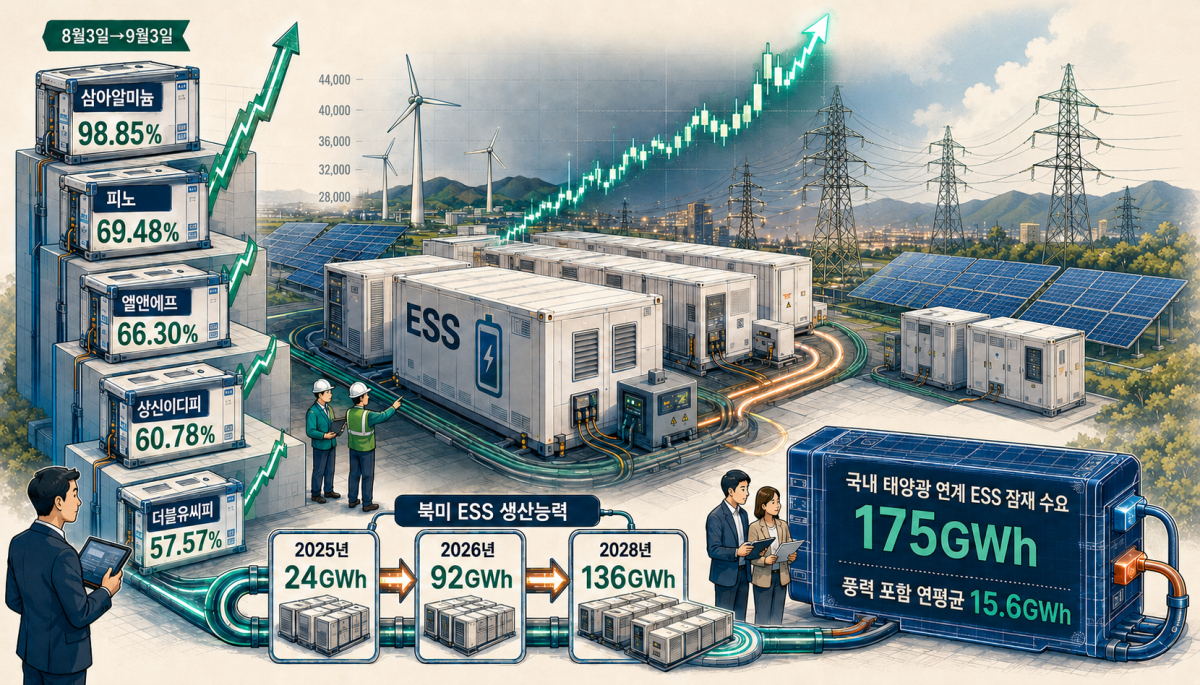
ESS Stocks That Soared in a Month… Is There Room for Further Gains?
네이버뉴스 · 2026.09.03
📰 View original
They Said They Would Build the ‘Second Semiconductor’… But Government Battery Support Measures Have Lost Steam
네이버뉴스 · 2026.09.02
📰 View original
Government Expands EV and ESS Investment… K-Battery Big Three Expected to Benefit - Banronbodo.com
네이버뉴스 · 2026.09.03
📰 View original
“52,000,000,000,000 KRW ESS Market Is Opening… Samsung SDI’s Savior to Help It Escape Losses Takes the Stage” - NewsQuest
네이버뉴스 · 2026.09.03
📰 View original
Comments 0
to comment Login